Inside Maven’s Insights Dashboard for dealerships: Localized market share and competitor analysis
Maven’s Insights Dashboard provides dealerships with hyper-local insights and actionable data to improve streaming advertising and grow market share.

June 12
Share this blog:
Streaming has become a must-have channel for automotive advertising, but for most dealerships, getting access to meaningful, truthful insights is still a challenge. Reporting is often vague, generic, or disconnected from real outcomes. Maven was built to change that.
Maven is a streaming analytics platform purpose-built for dealership market share growth. Every feature is designed to help dealerships understand, protect, and expand their share—because market share is the clearest measure of performance and the hardest to manipulate. Modeled on more than 75 million attributed dealership outcomes from thousands of campaigns, Maven turns complex data into actionable, personalized intelligence. It shows what’s working, what isn’t, and what to do next.
The first interface in Maven is the Insights Dashboard, which brings dealerships hyper-localized market share analysis, competitor intel, and provides growth recommendations that turn media performance into measurable business outcomes by putting market share front and center.
Here’s a closer look at the six tabs that power the dashboard—and how each one helps you compete smarter and grow faster.
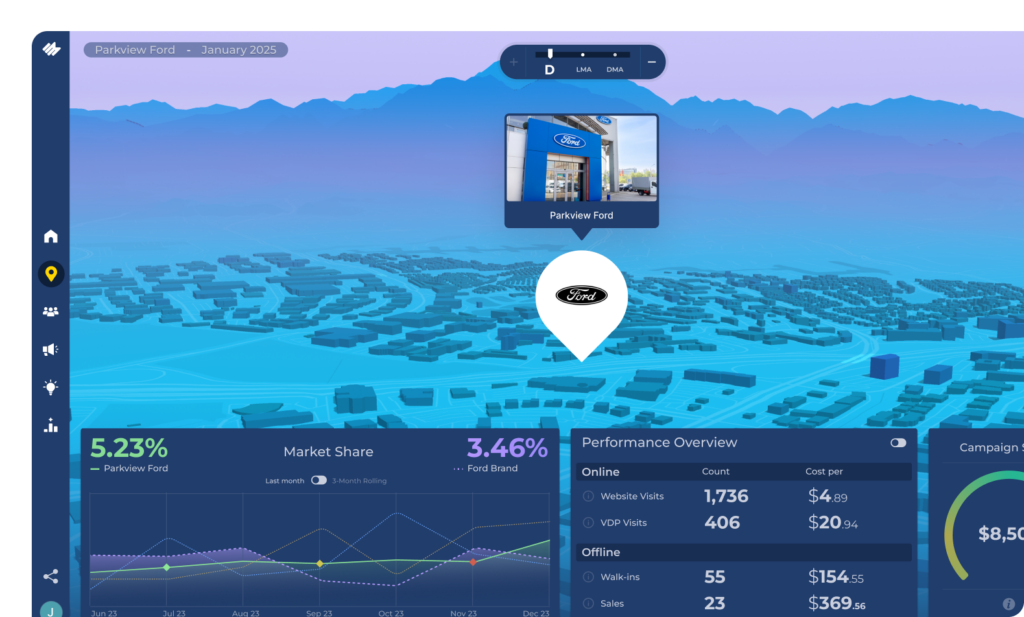
This tab offers a comprehensive look at how your dealership is performing within its local market. It provides your monthly share of total new cars sold, independent of streaming campaigns, so you can see the honest lift in your backyard.
You’ll also see your OEM brand’s market share in the broader DMA, along with a lift analysis that compares your dealership’s results to your brand’s overall performance, helping you truly evaluate your growth.
An interactive layered 3D map lets you explore your local market and DMA in detail, showing competitors’ market share data and growth trends over time.
Alongside this, key attribution metrics like website visits, VDP activity, and walk-ins offer insight into the direct impact of your streaming campaigns.
Maven doesn’t just show results. It puts your performance in the context of your sales market so you can understand how you’re stacking up and where opportunities exist to take more ground.
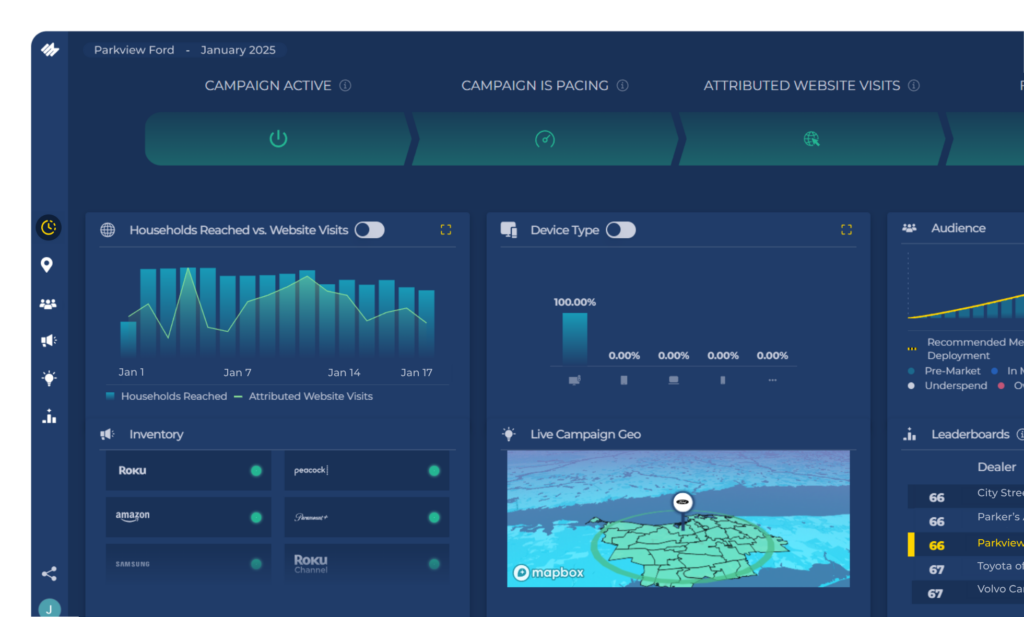
The Realtime tab provides continuous access to your live campaign data, updated daily. It shows attributed website visits, campaign reach, and how your media is being deployed across devices and dayparts.
A live geotargeting map displays where your impressions are being served, while an inventory view highlights where your creative is active across streaming apps. The sales leaderboard also offers a preview of your latest sales ranking within your DMA.
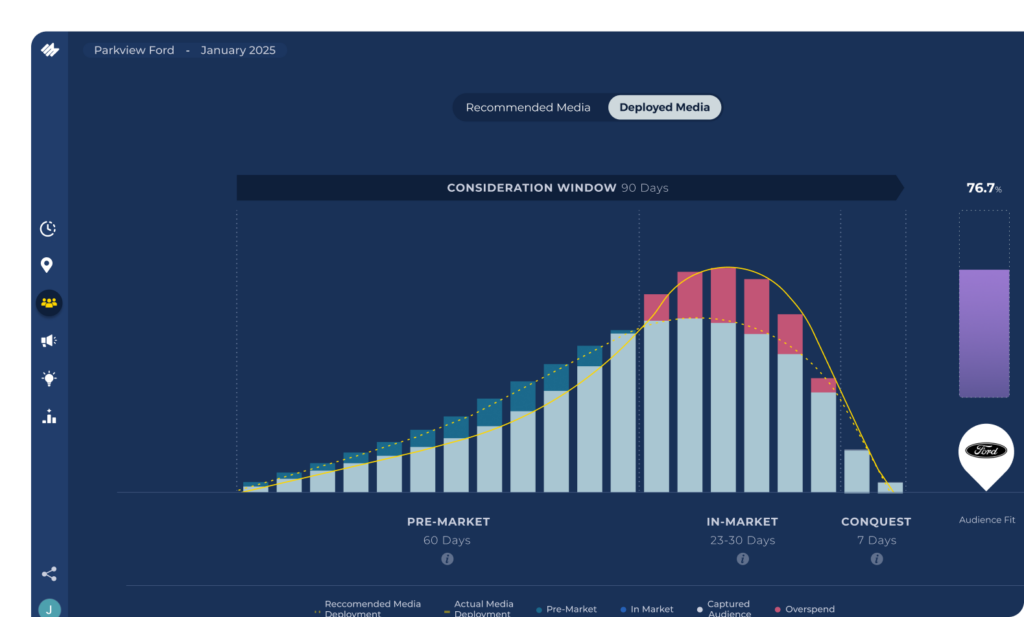
The Audience tab compares your actual media deployment to Maven’s recommended targeting strategy, so you can see how well your campaign’s budgeting aligns with the way people shop for cars.
It visualizes the automotive consumer journey and pinpoints where your campaign is over- or under-delivering. This isn’t just a review of who you reached, it’s a strategic check-in on how effectively you’re reaching them.
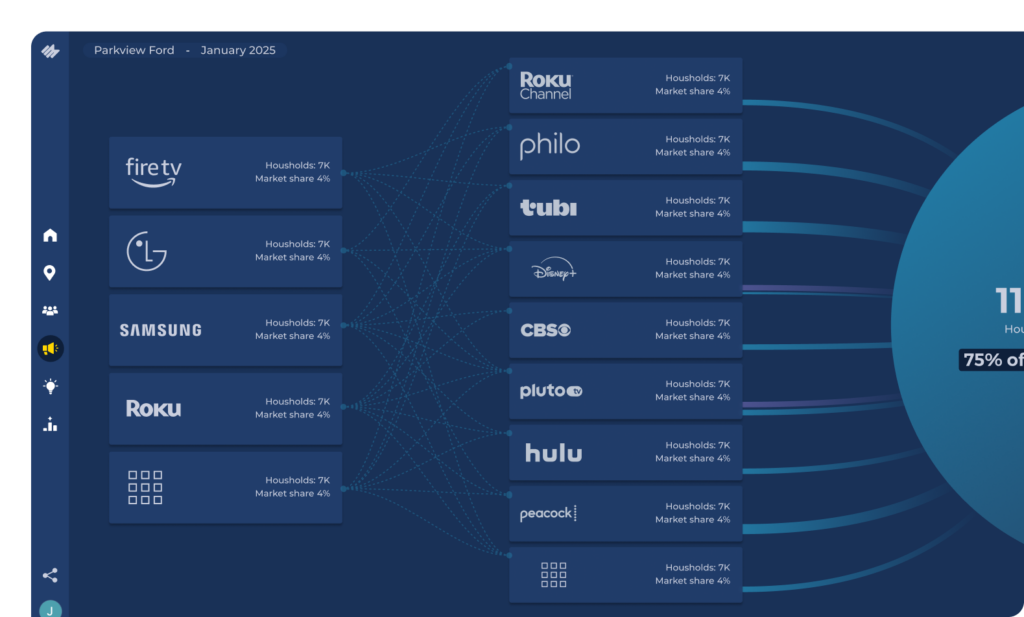
Transparency matters in streaming, and the Ad Inventory tab shows you exactly where your ads ran—down to the apps and operating systems.
You’ll see which Connected TV platforms your targeted car buyers were using, along with an interactive map of the media supply chain.
With buyers spread across many streaming apps, this tab highlights the full scope of your reach and targeting.
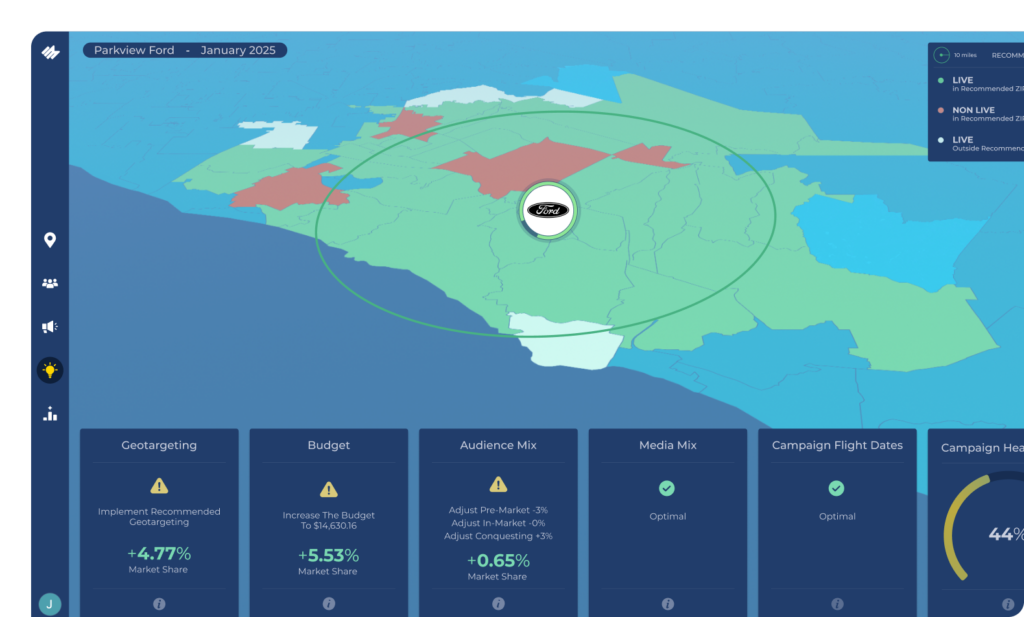
Most dashboards stop at reporting. This one helps you grow.
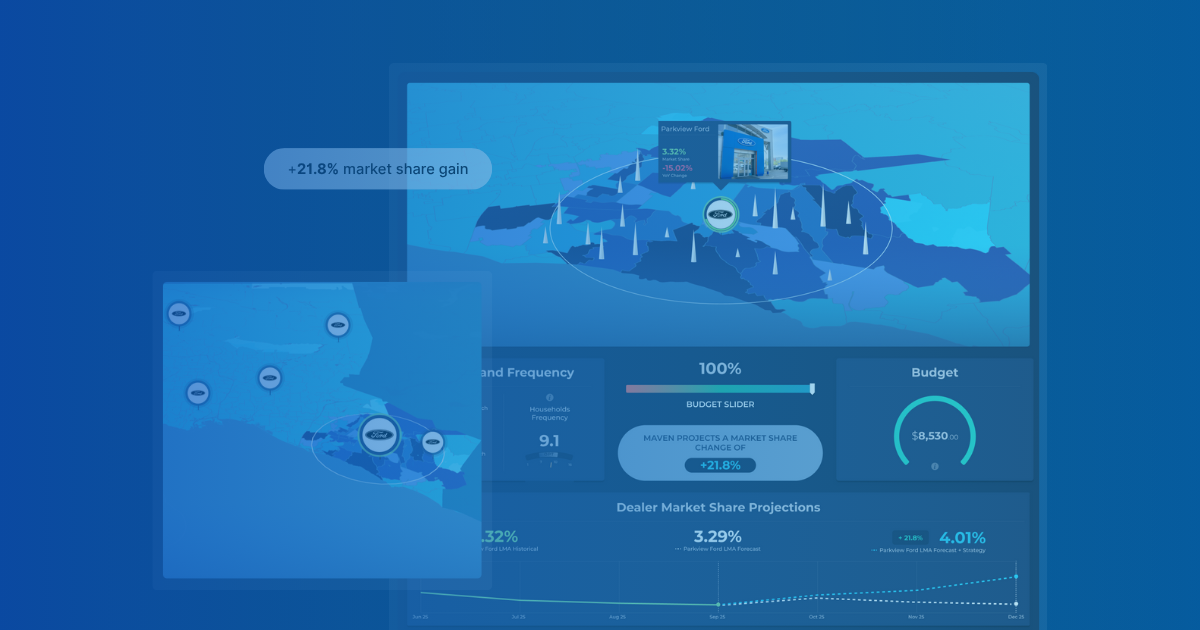
The Opportunities tab shows you where your market share could go next, with detailed recommendations across campaign levers like geotargeting, budget allocation, audience mix, media mix, and flight duration.
You’ll see how closely your campaign aligns with Maven’s recommendations for your unique store—and what kind of market share gain is likely if you implement them. Visual zip code mapping lets you quickly understand where the potential lies in geotargeting.
It’s not guesswork. It’s a strategy for market share growth, backed by millions of dealership conversions.
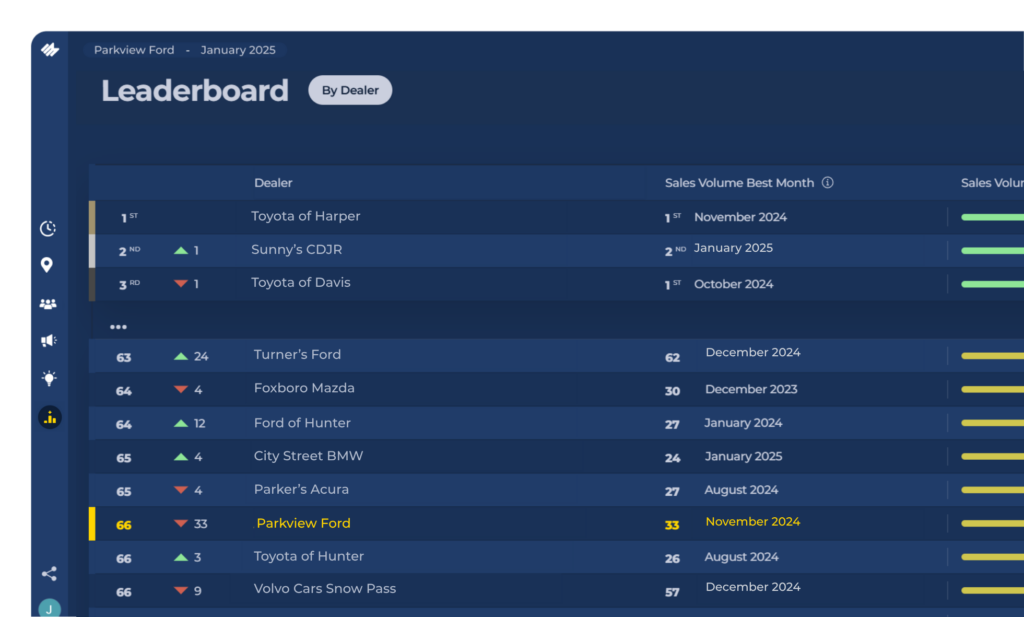
The Leaderboard ranks your dealership’s sales volume within your DMA, giving you a clear picture of your position relative to competitors in your market.
It’s a high-level view of how your performance measures up—and a quick way to track progress month over month.
Join the EMG mailing list.
Stay connected with EMG and get the latest posts delivered straight to your inbox.
EMG will handle your data pursuant to its Privacy Policy.
Ready to get started?
Learn how EMG drives measurable market share growth for dealerships.
Recent blogs.
View all blogs
Streaming Wrapped: 2025 highlights and 2026 predictions
2025 cemented streaming’s dominance across CTV and Digital Audio, with ad-supported tiers, app hopping, and platform consolidation shaping the landscape, while 2026 will be defined by mass consolidation, programmatic audio, and smarter, omnichannel streaming strategies.

PMAs and DMAs fall short: why dealerships should advertise in their Local Market Area
Advertising in your Local Market Area keeps your budget focused on the ZIP codes that actually drive sales, giving your dealership stronger, more efficient streaming performance than broad legacy boundaries.
Meet the Strategy Engine: A new way for dealerships to build data-backed streaming campaigns that grow local market share.
The Strategy Engine, now in the Maven platform, gives automotive marketers a free, data-backed way to instantly build personalized streaming campaigns designed to grow local market share using real sales, market, and performance intelligence.
Copyright © 2025. All Right Reserved